Tag Archives: #uncc

Guest Blog: Beth Martin and Heather McCullough, Assessment Beyond Counting

Recently my colleagues Beth Martin and Heather McCullough presented at Educause on our assessment agenda in Atkins Library.  I love this work, I am delighted to work with them here at UNC Charlotte.  I’m sharing the poster here because I think it’s terrifically important to get as many voices as possible into the conversation about what assessment is, could be, and should be for, in Academic Libraries, and in Higher Education generally.  I have blogged about the Mixed-Method, Interdisciplinary library before, and I think that this poster is a nice example of how we are going to operationalize that at Atkins, with partnerships within and outside of the library.

I’m including a summary in this post of their main points, and a link to their poster.

Making Big Data Small

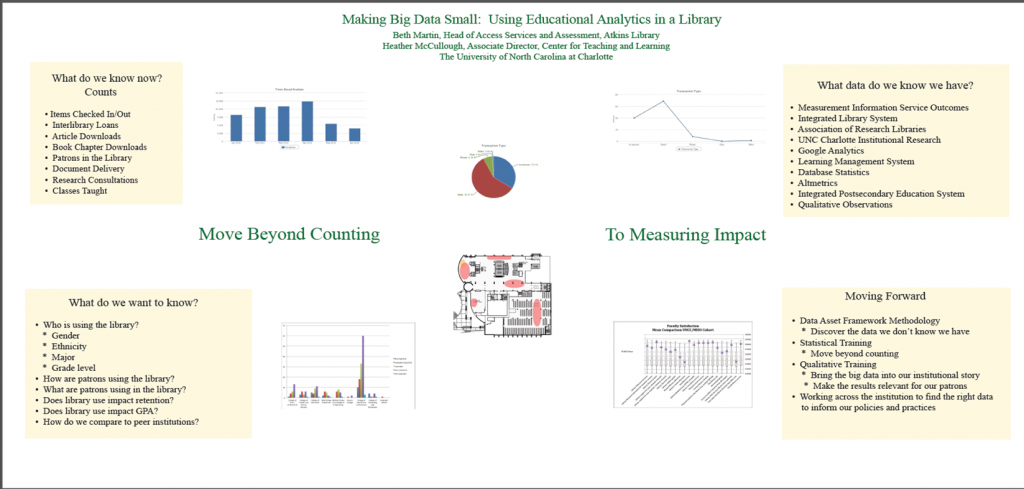
Click to get to .pdf

Educational Analytics and Libraries

Educational Analytics in this context encompasses both Learning Analytics and Academic Analytics.

Learning Analytics focuses on data about the learning process while academic analytics focuses on data about the institution.1

 UNC Charlotte Atkins Library is putting together an analytics initiative that will explore both learning and academic analytics through a library lens.


The Initiative


What we do now What we want to do How we will move forward
Count items and people How are patrons using the library? Discover what data we have using the Data Asset Framework Methodology2
Qualitative space assessment Explore impact of services across gender, race, ethnicity, major, grade level, etc. Statistical training

  • Move beyond counting
Impact of library on retention Qualitative research training

  • Make the big data relevant to our institution
  • Context
Impact of library on GPA Work across the institution using data to inform policies and practices
Compare to peer and aspirational institutions


The Tools

  •  Measurement Information Services Outcomes (MISO)
    • National Survey of libraries used to compare across institutions as well as inform internal practices
  • Integrated Library System
    • Main library system that stores usage data
  • Association of Research Libraries data
    • National library data
  • UNC Charlotte Institutional Research
    • Data analysis of all institutional research
  • Google Analytics
  • Learning Management System
    • Data on student usage
  • Library Database statistics
    • How are scholarly articles/books being used
  •  Altmetrics
    • Social and collaborative nature of institutional research
  • Integrated Postsecondary Education System (IPEDS)


  • Qualitative studies
    • Space use
    • Classroom use
    • Student Learning Outcomes analysis for library instruction


The project is in the first stage of the Data Asset Foundation methodology, which is scheduled to finish this December.  Once we have a clear picture of the available data we will look at our initial research questions to determine what we can explore with the available data and what data we may need in the future.


Contact Information

Beth Martin, Head of Access Services and Assessment

Atkins Library, UNC Charlotte

sarmarti@uncc.edu


Heather McCullough, Associate Director

Center for Teaching and Learning, UNC Charlotte

hamccull@uncc.edu


Citations

  1. Penetrating the Fog: Analytics in Learning and Education. (n.d.). Retrieved September 29, 2014, from http://www.educause.edu/ero/article/penetrating-fog-analytics-learning-and-education
  2.  Data Asset Framework | Digital Curation Centre. (n.d.). Retrieved September 29, 2014, from http://www.dcc.ac.uk/resources/repository-audit-and-assessment/data-asset-framework


The Cartography of Learning

So, I’ve been thinking about mapping, not just because I have these maps I collected at UCL in March, but also because I’ve been thinking more about the utility of processes such as the V&R mapping that we have been using in our research.  What Dave White has said to me is that mapping exercises like V&R give us processes to offer people, but no answers, that in fact people use the processes to find their own answers.  It’s not our job as researchers to provide answers, in this framing, but to ask effective questions that prompt people to find their own way.  As usual, my first instinct was to be annoyed by this. My annoyance stems now from thinking that Dave is probably correct.

I am often asked for Answers when I give talks about what is going on with faculty and students and libraries and education generally.  While it’s tempting to try to provide Answers,  I think that I’m much better at coming up with more questions.  And ultimately, that might be more useful, as I think I’m probably not the one who should be Answering.

Cognitive mapping exercises at UNCC and UCL reveal people’s learning landscapes.  Thinking about cognitive mapping in the larger context of mapping exercises  made me consider the possibility of a discussion around the cartography of learning, that is, all the different ways we try to capture and visualize what people are doing when they are learning.  We are mapping (or having people map for themselves) what they perceive to be there, and in the mapping we receive a revelation, not something predictable, or predicting.  We also do not have a precise rendering of actual practices, but an interpretation of practice.  How can we use the maps to build more deeply observed pictures of behavior?  How do we deal with the fact that maps are only ever representations of a lived reality?  “The map is not the territory.”

If the Google Earth of Bloomsbury looks like this:

And the Google Map looks like this:

And the Tube map, itself a concept map of sorts, looks like this:

Then we have a map like this one I collected in March:

For this first year archaeology student, UCL is a series of spaces isolated from each other, but connected by the fact that he needs to do things, different academic tasks,  in each space (my favorite is the professor’s office in the lower left, filled with clutter except for a small clearing in which professor and students can sit to talk).  I can see that these spaces are connected, but he does not represent them that way.

This PhD student has drawn lines indicating how connected her spaces are, the ones in Bloomsbury, and the ones that are not.  She annotated the map with notes about the technology and particulars of the work she does in each space, which places have particular resources (content and people) she cannot get anywhere else, and marks cafes with the cups of tea or coffee that she goes there for.  She has glossed her own map–I can bring my own spin to things (and I will), but there is already interpretation here.

Cognitive maps, the V&R maps, these are all contributing to a kind of cartography of practice.  In the case of the cognitive maps I’ve been collecting from faculty and students, the mapping is an emic process, where the the practitioners themselves represent their own practices as best they can.

In V&R mapping workshops,  people map their own practices, but they are also asked to think about the practices of others.  We’ve done that in the V&R research project as well,  for example in this map, where we took practices invoked by the interviewee and plotted it in the V&R continuua:

map by Dave White and Erin Hood.

Here we engaged in the mapping of the traces of practices of others as an analytical tool, engaging in an etic process, imposing our interpretation of meaning from the outside looking in.

They map, we map, and possible meanings and definite questions can emerge from the process of mapping.

I have been working my way through Latour’s Reassembling the Social with a Twitter group of colleagues, and am only part way through.  Latour invokes the “cartographies of the social” (p.34) when discussing the need for researchers to pay attention to actual practices, to the lay of the networks in play, and to de-emphasize the interpretive leap while still in the process of figuring out what it is we are looking at.  I am also struck by Latour’s insistence that the best social science cannot privilege the perspective of the researcher, but must be embedded in the meanings and practices generated by the people being studied.  This, to me, is a plea for anthropology, but also for the sort of  lack of privileging that mapping exercises like these can inspire–these maps get their meaning from the intentions of the people drawing them as much if not more than from the interpretations we researchers later layer onto them.

Anthropologists are not always fantastic at not-privileging their interpretations of meaning, and I’ve been helped in this regard by the neo-Boasian appeal of Bunzl.  I frequently talk about being a sort of “native ethnographer,” as an academic studying academia, but Bunzl’s critique of the necessity of outsider status to anthropology is making me rethink that.  Our position as “outside” or “inside” is not as important as paying attention to what is present, and describing it as thoroughly and thoughtfully as possible.  It is not that interpretation is impossible, but that what we think things mean can and should be informed by a variety of perspectives, including that of the people among whom we are doing our work.

What is important about the maps, and I think about research generally, is the process, the questions and the discussions they inspire, not the end result.  Thoughts about meaning should emerge from the discussion, from the process, and should never be framed as The Answer.

References:

Bunzl, Matti (2004), Boas, Foucault, and the “Native Anthropologist”: Notes toward a Neo-Boasian Anthropology. American Anthropologist, 106: 435–442. 

 
Latour, Bruno (2007) Reassembling the Social:  An Introduction to Actor Network Theory. Oxford (Oxford University Press). Page numbers refer to Kindle edition.
 

Images:
Google Maps, Google Earth screen shots
Tube map is a crop of:  http://www.tfl.gov.uk/cdn/static/cms/documents/large-print-tube-map.pdf

Into the Field

So I have been noisy on Twitter lately, but relatively quiet on this blog, and that is in part because I have been gently (and not so gently) freaking out and getting prepared for going to do six weeks of fieldwork starting at the end of February.

The project will allow me to collaborate with the estimable Lesley Gourlay at the IOE, and Lesley Pitman at UCL, and extend and expand a project that I piloted in 2011 with the help of the UCL Institute of Archaeology.  There’s a .pdf of the report here.

March is going to involve me collecting cognitive maps as well as conducting interviews among students and faculty at the Institute of Archaeology, the Bartlett school of Architecture, and the SSEES.  I will also be spending time doing immersive observation in each of the 3 libraries, using the SUMA tool to facilitate head-counts and also an accounting of activities within each space.  Lesley Gourlay will be doing the same among IOE students and faculty, and at the IOE library.

I have collected cognitive maps from undergraduate and graduate students at UNC Charlotte already, and my graduate assistant will be conducting interviews and observations in Atkins Library while I am in London.

By the end of March, we will have a lovely comparative collection of qualitative data to play with.  Even a project as small as this will generate hours of interview data, and a rich body of field notes to mine for insights that such a comparative exploration of academic libraries can yield.  I am so, so excited to get to do this.

And part of my excitement comes from my strong investment in “going into the field.”   The anthropologists out there know how deeply felt that trope is in our field–yes, my work at Atkins library is my primary research location, but I have been “brought up” to think of field sites as Away (however problematic that may be).  And academic libraries in London are distinct in many interesting ways from the large, generalized, suburban one in which I work in Charlotte.  UCL/IOE libraries are specialized places, scattered across an urban landscape, and also contain materials on some of their shelves that would rightfully be in restricted-access special collections in the US.  I will acquire a new “arrival scene,” coming into the site libraries for the first time, I will have a new set of “key informants,” participants in my research, to interview, who are willing to share what they know with me so that I can learn, so that I can approach my library “back home” with fresh eyes, the familiar made exotic through the field experience.

It won’t be a completely isolated field experience, I’ve never been able to achieve that, and I think it’s probably to my benefit.  When I did my research in Belfast I was lucky to be embedded in a network of Queen’s U, Belfast graduate students, colleagues and eventually friends who helped keep me grounded when I was struggling with the usual alienating cliches of doing fieldwork.

In fact, I think that field experiences in applied anthropology in particular give the lie to the Anthropologist in Splendid Isolation cliche, not just because no anthropologist ever truly works in isolation (they are working with people!), but also because anthropology is always a team effort, even if it’s not immediately visible as such.  I am collaborating with colleagues in UCL and IOE, and this project began as an effort initiated by Dr. Bill Sillar in the Institute of Archaeology.  The work I have done and will do in London is a direct result of the work I’m doing here at UNC Charlotte, working with my colleagues in Atkins, and with my graduate assistants (the Atkins Ethnography project has benefited from the work so far of 4 different graduate assistants, and will continue to hire graduate students as a part of its research workforce), and undergraduate researchers.  My work is informed not just by what I find interesting, but what my boss needs from me, what questions my colleagues bring to me.  It’s a group effort.  There are no lone wolves.

I will also in this trip, have opportunities to talk about my work with colleagues old and new.  I’m participating in a workshop on Visitors and Residents, along with Dave White , Ben Showers, and Lawrie Phipps at the Jisc Digital Festival.  I’m speaking about my work at UNC Charlotte with Bryony Ramsden and her colleagues at Huddersfield.  There will be many chances in London to talk at length about my work, and especially to listen to people engaged with work that I need to pay attention to.

I can’t put into words just how delighted I am that I am finally getting to make my ambitions for a comparative, international ethnography of academic libraries begin to come to pass.  This phase of my research is funded by a UNC Charlotte Faculty Research Grant, and I hope to be able to take this project and springboard to a larger, more comprehensive treatment of all of the UCL site libraries, with an eye to informing with qualitative research much larger discussions of the role of academic libraries in Higher Education in the UK and the US.

But in the meantime, I get six weeks.   I’m going to make them count.

Playing with Cognitive Mapping

I am messing around with cognitive mapping instruments, stolen with Andrew Asher’s blessing from the ERIAL toolkit (I know, I know, I don’t need anyone’s blessing because hey, that’s what toolkits are for!  Especially those posted on the web).  I am doing this in part because photo diaries, while useful and capable of yielding rich information, are really really time consuming and difficult to get students to do.    I am still very much hoping to get back to University College, London, to continue the work I started there in 2011, and when I am there I’d like to use cognitive maps as well as structured interviews and immersive observations to get a sense of how and why various learning spaces are being used by UCL students and faculty.

So, I’m doing some here at UNC Charlotte.  At the very least, such an exploratory exercise can give us a sense of what our undergraduate and graduate students’ spatial networks look like when they are written down.  The data I’m collecting can also begin to serve as a comparative set for the data that I hope to be able to collect in the UK.

I just want to put some of the maps here because I think they are really interesting.  I am of course far from the only one doing this–Lesley Gourlay at the IOE and her colleagues have done some mapping exercises, and of course there is the aformentioned ERIAL work, among other ethnographic projects in the US.  The students were given 6 minutes to complete each map, and were asked to map all of the places that they go to/inhabit in some way for their academic work.   I was specific in saying that the spaces could be on- or off-campus.    The maps posted here are undergraduate maps–I have maps from graduate students that we are still processing.  In general, undergraduate space maps indicate the need for them to be in places that make it easy for them to get to the other places they need to go to.  If they have class in a particular building, they are more likely to study in the Student Union than the library, because the former is closer.  If they live away from campus, they might be likely to have off-campus cafes, etc. on their maps as work spaces.  The choices they make about where to settle in to study are not made in a vacuum.  There is a similar diversity to the spaces they find themselves in, however, in part because undergraduate classes occur in a variety of buildings in different parts of campus, and are not necessarily taught in the building that house their major programs.  Graduate student maps (in process) have less diversity of spaces, because they are much more tied to the departmental labs and spaces of their degree programs.

The students worked for 2 minutes in each pen color, beginning with blue, moving to red, and then ending with black.  Some students finished before the 6 minute mark, resulting in some maps in just 2 colors (such as #7 shown here).

This undergraduate lives on campus, and has drawn straight lines connecting all of the places he needs to go.  The library is one place in a larger network, of course.  Several of these building are classroom spaces.  This senior lives in an on-campus dorm.  There are no off-campus spaces shown here.
This sophomore lives in an off-campus apartment relatively far from campus, but her boyfriend’s apartment (the building in the upper left corner) is closer in.  She has mapped campus buildings such as the Student Union and various classroom buildings, but also included important spaces such as where her youth group meets, and the 24-hour cafe Amelie’s.  The library does not figure in her mental map of learning spaces.
This student lives close to the South Carolina border, nearly a half an hour from campus.  She has included several cafe or bookstore spaces, all of which have free wi-fi, but not all of which are open 24 hours.  “School” is the university campus, and she has not differentiated places within the campus, because she has so many other places she inhabits.  The library on this map is the public library closest to the university.
This junior has sketched only the places within the library he inhabits on the left hand side of the drawing.  He has put in study rooms, and indicated where the study rooms are in the building by their proximity to round tables with computers on them (these are on the 1st floor).  His other learning spaces are in his close-to-campus apartment, on the right hand side.  He has sketched his living room furniture (comfortable chairs as well as desks), and his bedroom.

Guest Blog: Mitchell L. McGregor on groupwork, observing spaces, and the Prequel to our new spaces

Last time I blogged on some of the work my current architecture student, Allison Schaefer, is doing in the new ground floor spaces of Atkins Library.  This time you are going to hear from Mitch McGregor, whom I advised last year during his MA (architecture) thesis research.  Mitch did his work in our ground floor before it was reconstructed, and the work he did helped inform decisions we made about furniture and technology in our new student spaces.  All of Mitch’s work was covered by the Atkins Library Ethnography IRB Protocol.

**************************

I wanted to find a way to design a space based on research of what inhabitants really expected from the space. I chose the Atkins Library due to the amount of people that use its spaces,  and the variety of activities done there. My intent was to observe the activities that were taking place, and to try to understand why certain group spaces that had been tried in the library were not being very successful. What was causing these spaces that were equipped with new useful technology to be overlooked?
After observations and a few low technology experiments in different parts of the library, I decided to find a specific space that would be more conducive for group dynamics.  I chose the corridor on the Atkins ground floor connecting the main stair and the coffee shop as the area of study.

Part of the ground floor in Atkins Library, Spring 2012.
This space had areas that allowed both private and group work mainly due to the type of furniture and arrangement of it. I observed that people wanting to be alone would come and sit at the long tables between each “bay” with a whiteboard, couch, coffee table, and soft chairs.  This “living room” arrangement of furniture facing white boards promoted group use of the space. The space was adjacent to a busy travel corridor, and people working there seemed comfortable communicating aloud to group members. During my observations, I sketched diagrams to analyze the types of activities that were happening in this space.  Here are some examples of the cleaned-up drawings (created in Adobe Illustrator): 
The long table that tended to attract students studying alone is on the left.  The “living room” arrangement is in the center, comprised of a couch, chairs, and coffee and end-tables.  In this sketch, 2 students are working at the whiteboard, and using the coffee table to hold the laptop and textbook they are consulting for their studies.

Here one student is taking notes on the couch, referring to material on the laptop, while the other sketches out thoughts on the whiteboard.

The student at the long table is referring to a textbook and laptop while the other uses the whiteboard to think through the reference materials.
My goal was to understand what people were already coming to this space to do. Rather than recreate the space with a new type of activity in mind, I wanted to think about redesigning the space to enhance the current use. I observed the space for about 12 hours, and found that I groups were coming to this space for a few main reasons. One was that groups would come to the space to work on problems or brainstorm, often using the whiteboard while referring to a book or laptop.  This often became difficult because there was no place to put books or laptops that was adjacent to the white board. Other groups used the space to work on group presentations, by sitting in the couch area and working from one or multiple laptops, discussing a group project.  I then derived scenarios for additional activities that could happen in this space if certain amenities were added.  I thought the space could benefit from a large screen adjacent to the whiteboard that students could hook up their laptops to. To allow for multiple uses, I decided the screen should be able to be connected to while near the whiteboard, as well from sitting in the sitting area facing the screen. I chose this arrangement:
  
 In one week I spent about 56 hours observing this space, varying my time of observations from early morning to after midnight. I observed the screen station was used for every thing from a cell phone charging station , to practicing power point presentations, to solving physics equations.  The first few days proved to be difficult, because some things that I as the designer took for granted were not obvious to new users. For example, I thought it would be obvious how to plug into the screen, but ended up having to make the cords far more obvious than “sleek” designs would allow for.  
As I worked through these issues and tried to make the installation more user friendly, I also conducted several interviews. I asked users of different varieties what they liked and disliked about the space and what could be improved. Most students said they really liked how they could move things around in the space, such as the furniture or where they connected to the screen. The space met their basic needs, yet was manipulable to specific groups’ needs.  The more flexible spaces can be the more apt people are to use them. 


This process showed that with research into what a space is currently used for, and how those current uses can be enhanced proves much more efficient than just creating a space and intending for specific activities to take place there. Students wanted a semi-private space that they could adapt to various types of group work. The possibility of multiple types of media showing information at the same time, in this case, whiteboard and media screen, allows the group to function even more efficiently. Students also want this technology to be easy to use; if the technology in this space takes too much of a learning curve it is possible that students will avoid it. Overall, a research-based process allows designers and educators to greatly increase the success and efficiency of a space.
Looking at the new spaces now, a year since the original research started, it is great to see how the new spaces have implemented some of the discoveries of the research. The new spaces that have both white boards and media screens where students can connect allow for the group collaboration and efficiency.  The type of furniture and dividers being used also give the students power over the space they are working in. 
**************************************************
I would add to what Mitch has written here that while his research was just part of the information we compiled and responded to in thinking about and designing the new ground floor, it was a crucial part.  Because it was grounded in the actual behavior of our students, we could use this work to think through ahead of time the details that demanded our attention.

_______________

McGregor, Mitchell L.  Principles of Space and Interaction (unpublished M.A. thesis) Department of Architecture, University of North Carolina, Charlotte, NC.

New Learning Spaces and the role of Ongoing Research

This is going to be one in a series of posts, because I’ve got fun maps to share, and if I share them all at once, the post will be entirely tl;dr (if it isn’t already…)

Atkins Library recently renovated our “basement,” that is, we took space that had been inhabited by staff doing the work of the library, gutted it (having found new places for our staff to work in), and turned it into  an array of spaces in which students can do collaborative work.  Here is what it looked like before there were people in it (photos by Cheryl Lansford, Interior Designer for UNC Charlotte):


We have created configurable furniture arrangements in some areas, and more fixed arrangements in others.  This picture shows the T1 touch screen tables (which also have screens at the head of the table, so students can plug in and share from their laptops. 
This is a view into one of our new group study rooms, with tables that are wheeled as well as wheeled task chairs.  Surfaces near the digital screens allow students to share from their laptops, and there is also a dedicated computer for them to work from if they do not have their own device with them.  Whiteboards and the glass walls are meant to be written on (and are).
The space just outside of the library cafe has been set up to be more cafe-type seating, but with larger low tables, to accommodate the need to spread out with laptops, books, notebooks, and even more than one person’s “stuff” that they are working with.  There are outlets in the wood-paneled pillars, to allow for student to plug in wherever they want to work.
The most configurable part of the open space (that is, the space not contained in the study rooms), has more of the wheeled tables and task chairs, as well as some soft seating (relatively lightweight, so it can be moved around), rolling whiteboards, and movable privacy screens.  

I think it’s all pretty cool.  Our students seem pretty happy with it so far.  We had a fancy grand opening for the space, and are grateful to all of the work that went into the design and building of it.  Some of the work was done by me, and students under my supervision, in the form of studying the kinds of behaviors that go into collaborative work, and thinking experimentally about how to reveal the best configuration of space and technology to facilitate effective student learning.

In many learning space design scenarios, the opening is the ending.  Universities continue to build new spaces, open them, and then walk away without thinking about what comes next.  What did they get right about the new spaces?  What did we get wrong?  How can we improve it?  When can we make changes?

I wonder sometimes if there is a fear of looking bad, somehow, if one goes in and makes changes to brand new spaces.  As if the planning wasn’t good enough, and that’s why we need to change things so soon after the opening.  I hope that is not the case, because we are already looking at the new spaces and thinking about things we need to change, to better respond to how people are actually using the space, rather than assuming that they are using the space as we imagined they would.

Sometimes, people just do their own thing.

To that end, I am enlisting the help of my graduate assistants this semester, Allison Schaefer (an MA student in Architecture), and Carrie Vass (an MA student in Communications), to systematically observe what is going on in our new spaces, and report back.  At this early point in the semester (the spaces have only been officially open since January 23rd), we already have several days’ worth of observations, and some nice visualizations of that observation data.  We are interested not just in how people are using the spaces and the furniture

Allison created maps of our ground floor using Revit, and then added color for movement or activity using Adobe Photoshop and Illustrator.  She mapped the kinds of activities people were doing, and also where people walked when they moved through the space, over the course of her observations.  First up:  the activity maps.

This shows where people were eating in the course of her observations (about 8 hours altogether).  The heavily blue areas are adjacent to the library cafe.  But eating is clearly happening near the nice windows overlooking the Student Activity center (on the right, in this diagram), and in the central parts of the spaces.

This is where studying is happening in the new space.  All over.

This is where talking in happening in the space.  Also, all over.

When we overlap the maps for eating and studying, we see that they are not mutually exclusive areas.  These maps were created from afternoon observations–if they included evening hours, we know that there would be even more overlap.  Atkins library has allowed food and drink in its spaces (except in Special Collections) for several years, now, and this shows that we are right to not treat these activities (eating and studying) as mutually exclusive.

Can you study and talk at the same time?  Our students can and do.  While some areas clearly show one thing or the other happening, the overlap is significant.

Just because students have a laptop open does not mean they are studying.  Likewise, just because they don’t have a laptop, doesn’t mean they are not studying.

These maps are beautiful and informative, and of course are only part of the picture.  Next post, I will talk about the maps Allison created that show how the density of occupation varies, as well as length of stay, and the maps that show circulation patterns through the space.  I will also have pictures of what the spaces look like when they are occupied!